
AlphaSeq: Turning Binding Measurements into Training Data
Randolph Lopez

At a Glance: Accurate and generalizable prediction of binding affinity from protein sequence is a highly sought-after goal for AI protein engineering. To address this challenge, we need an abundance of high-quality binding affinity measurements that span a broad diversity of sequence and structural space. Most current protein-protein affinity datasets are lacking in size, diversity, and quantitative precision.
Here, we discuss how AlphaSeq affinity data is uniquely suited to train the next generation of protein design models. Our analysis focuses on three key properties:
Reproducibility: do repeated or related measurements preserve binding relationships?
Comparability: do different platforms (e.g., AlphaSeq and biophysical methods) support the same practical decisions for protein engineering?
Volume: does the data have the scale and diversity needed for training generalizable models?
What does it mean to measure affinity?
Protein affinity measures the interaction strength between two proteins. For protein engineers, affinity is used to answer critical questions that inform downstream decisions: Does an antibody bind its target and how strongly? Does a mutation improve or weaken binding? Does a de novo designed binder form the intended complex? Does a binder engage its target specifically, or does it interact broadly with other proteins?
Affinity is typically reported as a dissociation constant (KD), which relates the equilibrium concentrations of the free binding partners to the concentration of the bound complex. Stronger binding corresponds to a lower KD. Established biophysical methods for measuring protein affinity, such as surface plasmon resonance (SPR) and biolayer interferometry (BLI), analyze purified proteins under defined experimental conditions, one interaction at a time. In these assays, one binding partner is immobilized on a surface while the other is introduced in solution, and the instrument records changes in signal as binding and unbinding occur over time.
AlphaSeq measures affinity in a different way: as a library-on-library, cell-based assay. A typical AlphaSeq experiment measures a large matrix of protein-protein interactions using DNA sequencing as a high-throughput readout of interaction strength [1]. Briefly, thousands of different proteins are displayed on the surfaces of yeast haploid cells, with one yeast library expressed in MATa cells and another in MATα cells. When the two libraries are mixed, interacting proteins between two haploid cells cause cellular fusion to form diploid cells. DNA barcodes originating from each haploid cell are sequenced to identify the interacting proteins, and relative sequence counts across the population of diploid cells reveal the abundance, and therefore the strength, of each protein-protein interaction. To place AlphaSeq’s relative binding strength measurements on an absolute affinity scale, each experiment includes reference interactions with known BLI-measured KD values. Across the reference interactions, the measured AlphaSeq signal is log-linear with affinity, providing an experiment-specific calibration curve for reporting the strength of novel interactions with apparent KD values, or KDapp. Throughout the following sections, KDapp refers to AlphaSeq-derived affinity measurements and KD refers to measurements by SPR or BLI.
Affinity measurements depend on experimental context. Measurements from biophysical methods, such as SPR and BLI, can vary with active protein concentration, immobilization conditions, analyte concentration, measurement times, buffer conditions, and fitting assumptions [2, 3]. AlphaSeq likewise has a distinct assay context defined by yeast surface expression, protein-presentation geometry, and culture conditions [1, 4, 5]. A reported affinity value therefore reflects both the underlying molecular interaction and the conditions under which it was measured. For model training, reproducibility within that context is critical because consistent measurements provide a stable signal from which models can learn [6].
Reproducibility: Do repeated measurements preserve the same binding relationships?
Calibration to biophysical protein affinity measurements places AlphaSeq measurements on a BLI-based affinity scale (KDapp). Reproducibility asks whether those measurements behave consistently within that scale: when the same interaction is measured again, does it return a similar affinity, and when the same set of interactions is measured in a related display format, does AlphaSeq preserve the same ranking? For model training, reproducibility is essential. Affinity labels need to preserve the topology of the underlying interaction landscape, so that quantitative differences correspond to differences in binding rather than uncontrolled variation from assay runs, library construction, display format, or data processing.
Two case studies illustrate AlphaSeq reproducibility, drawn from years of assay development and internal benchmarking:
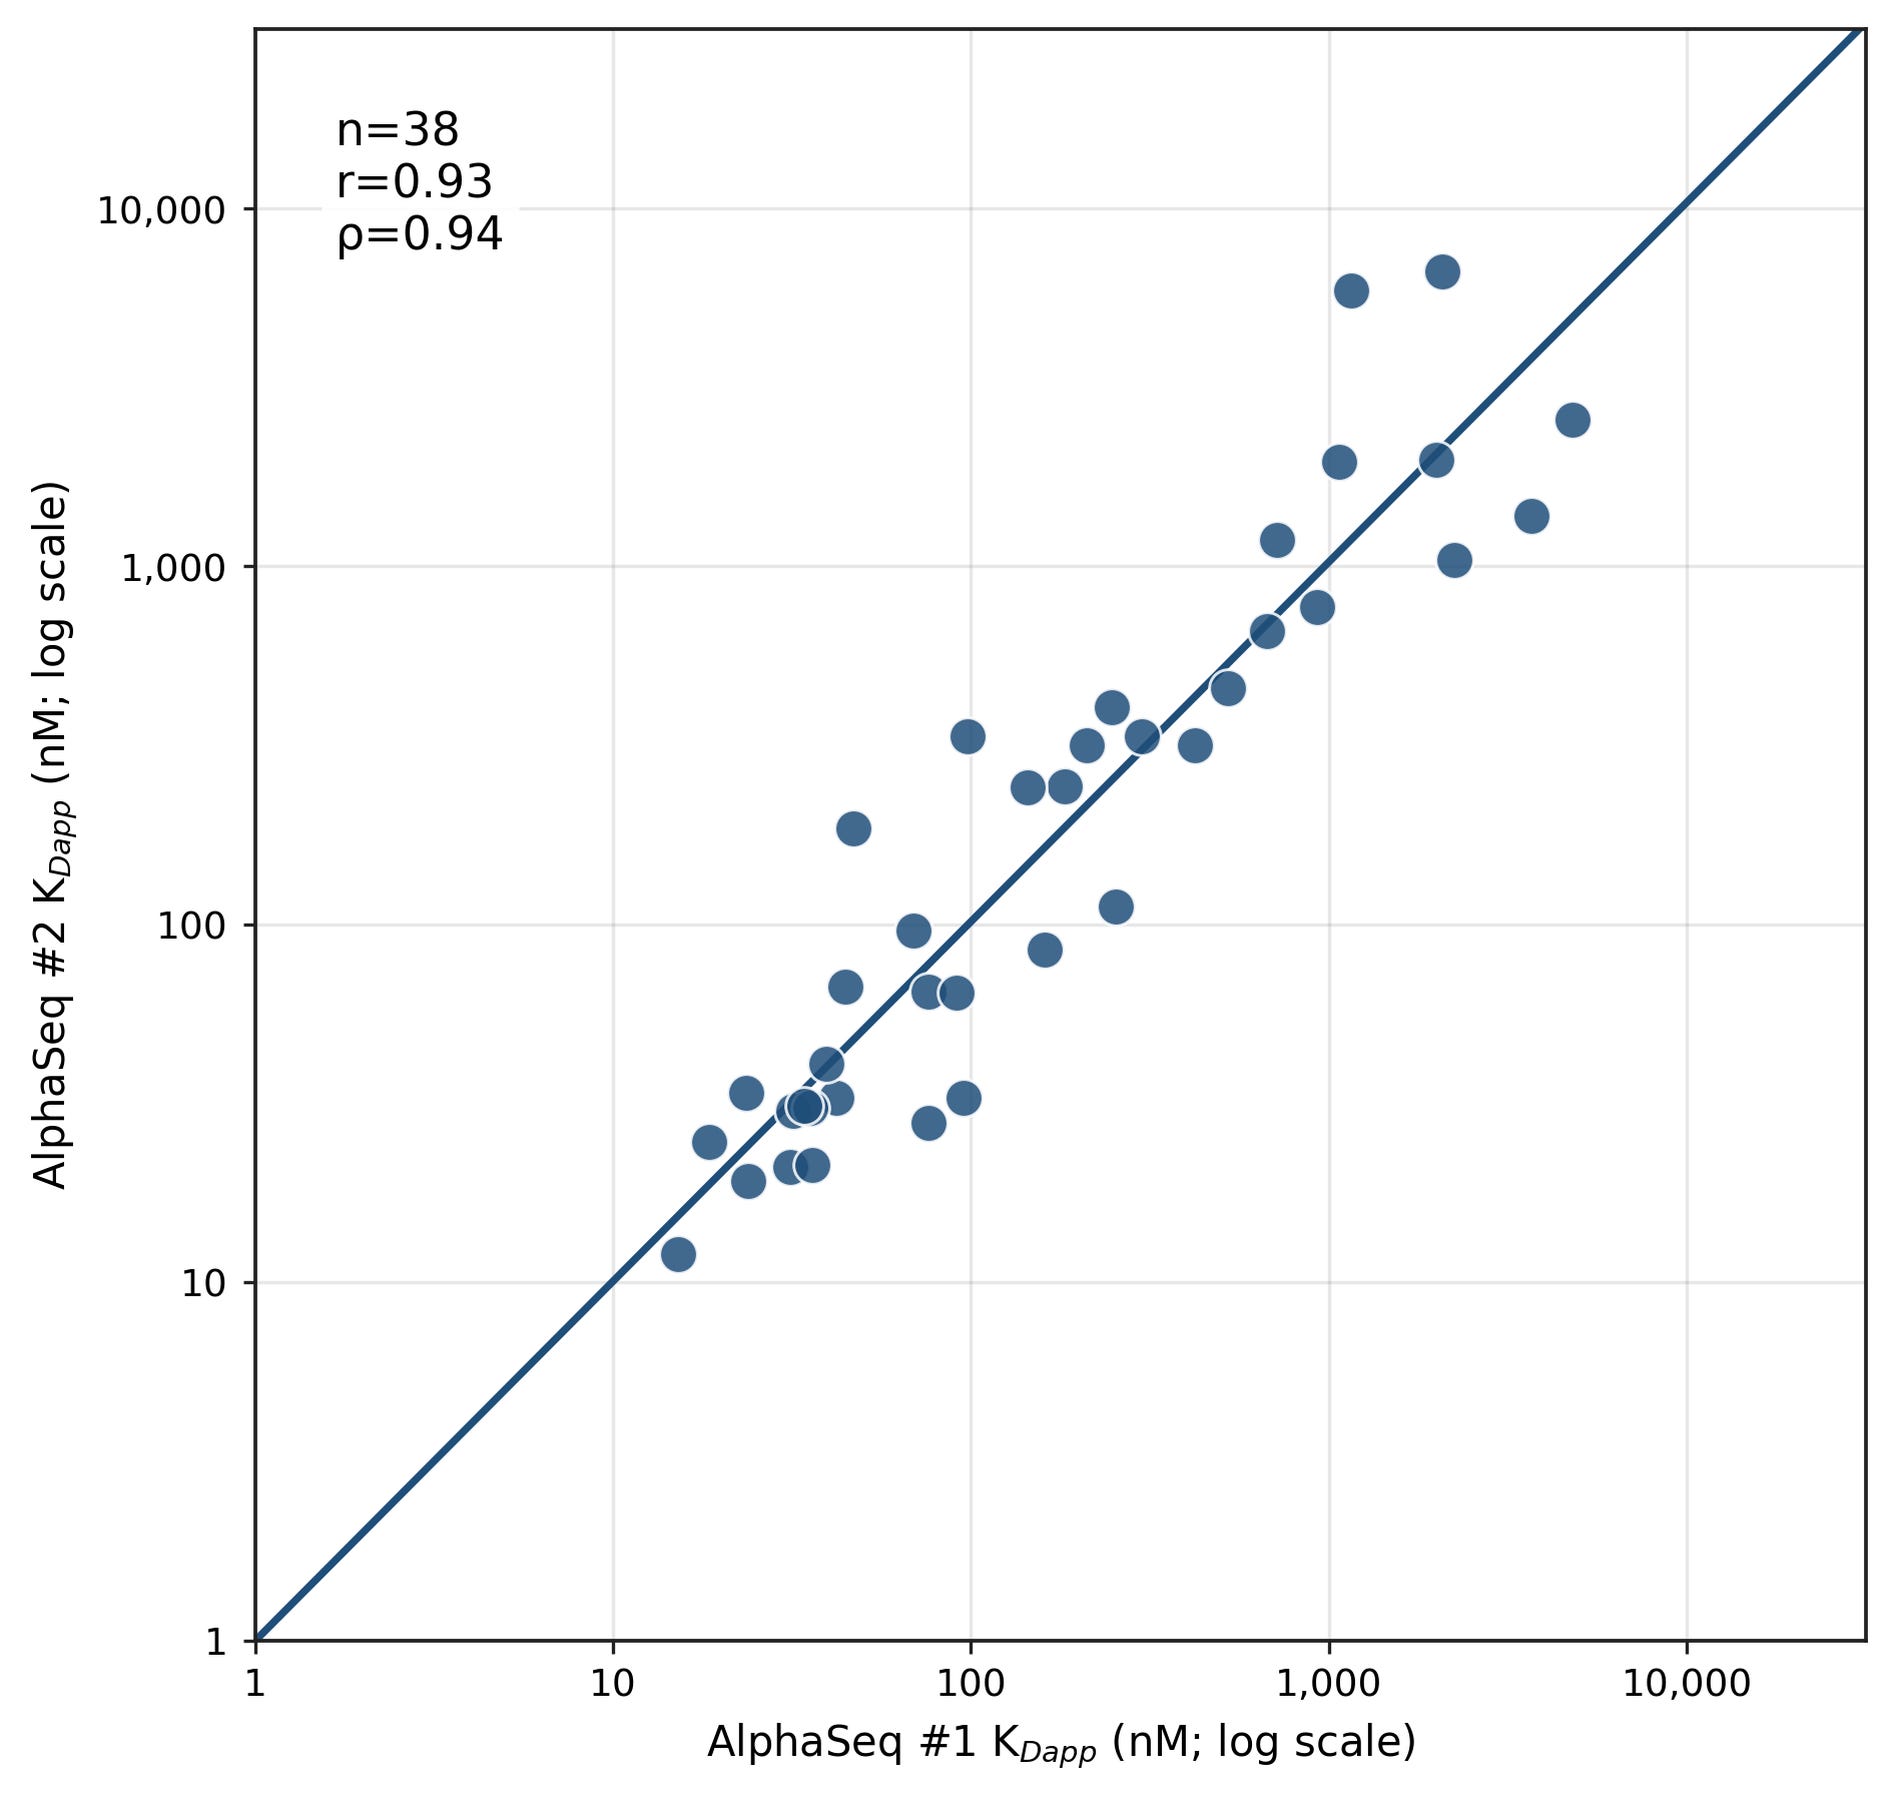
The first example looks at reproducibility across separate experiments for a diverse set of antibody-antigen interactions. We selected 38 antibody-target interactions spanning different antibody parents and target antigens, then measured the same interaction set in a second independent AlphaSeq experiment. In the replicate experiment, the DNA libraries were independently constructed, the yeast libraries were newly transformed, and the full AlphaSeq workflow was repeated. The resulting affinities were highly correlated across experiments (Figure 1; Pearson r = 0.93), showing that AlphaSeq recovers similar interaction strengths across independently generated libraries and assay runs.
The second example looks at reproducibility of relative affinity when the same interactions are measured in different display contexts. We measured 19,307 antibody variants against one protein target in both single-chain Fv and Fab formats, then compared the resulting KDapp values (Figure 2). Despite the change in antibody presentation, the two formats were strongly correlated across nearly twenty thousand measurements (Pearson r = 0.84). The systematic offset and different dynamic range between formats are expected; moving from Fab to scFv changes presentation geometry, expression, and stability. What matters for reproducibility is that the ranking is largely preserved.
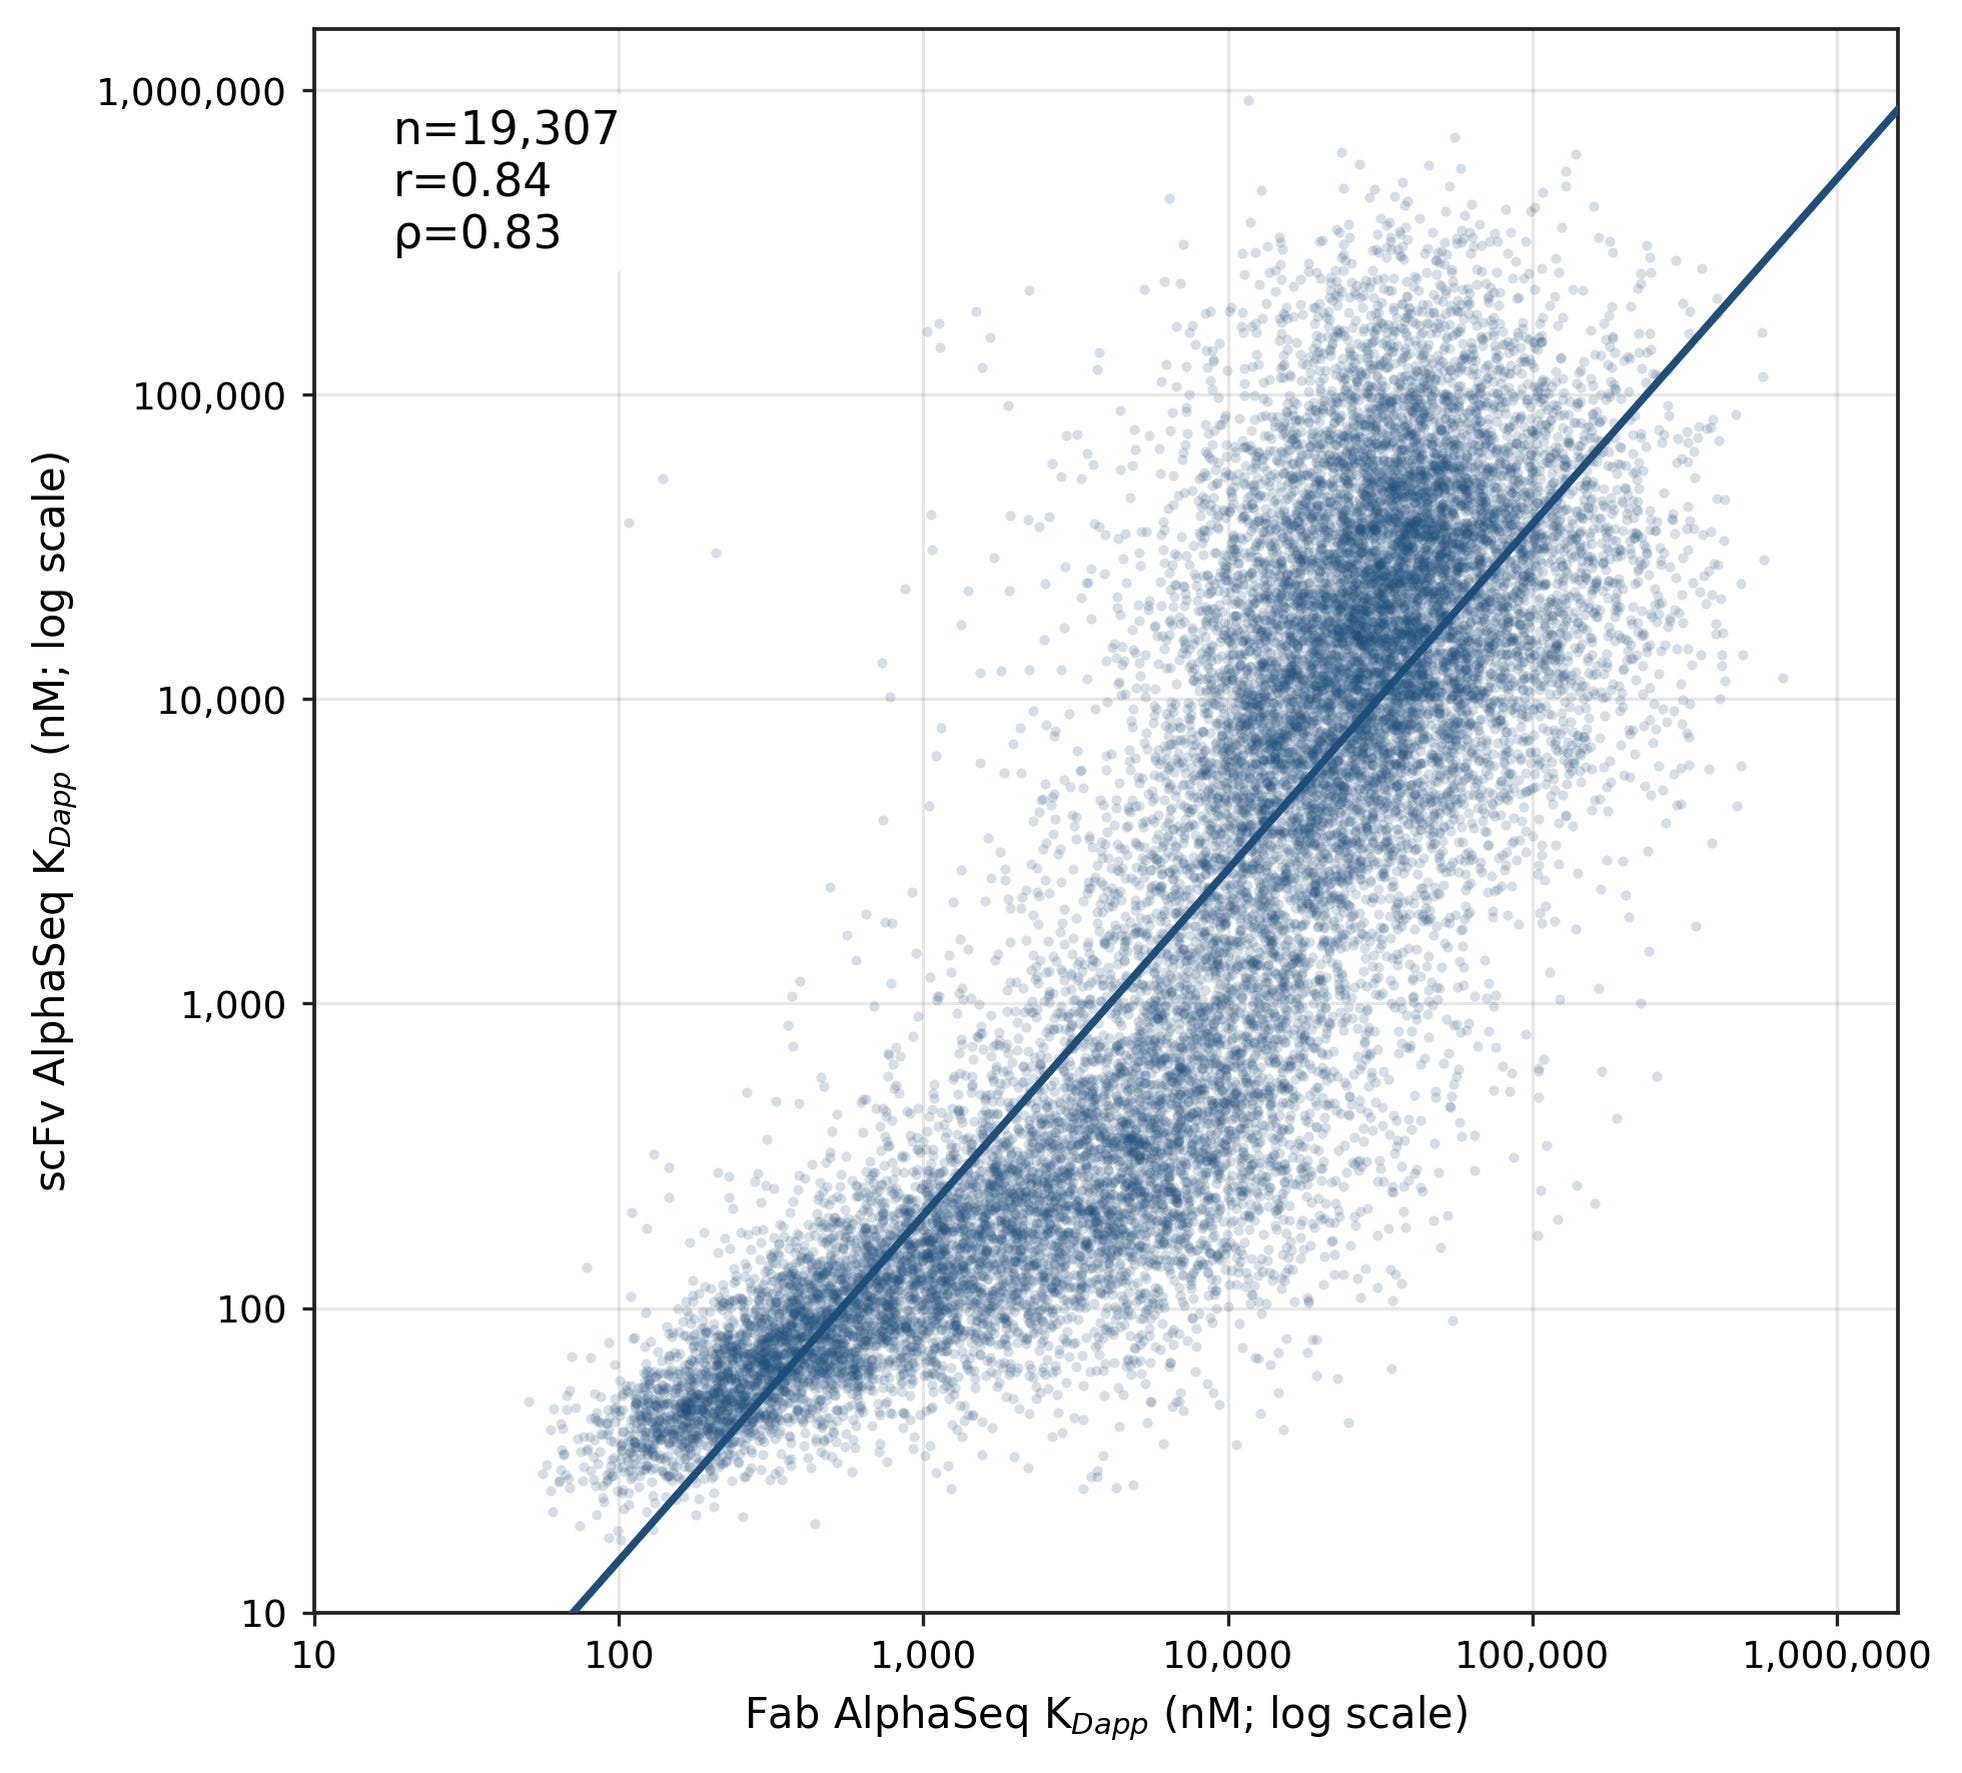
Together, these examples demonstrate reproducibility at two levels: across independent AlphaSeq experiments and across closely related display formats. In practice, this means AlphaSeq can compare strong binders, weak binders, non-binders, cross-reactive binders, specific binders, and closely related variants within a consistent assay context. Consistency matters for model training: when affinity labels are stitched together from many disparate contexts (e.g., public databases), models learn dataset-specific artifacts instead of meaningful binding relationships. By measuring millions of diverse interactions in an identical experimental context, AlphaSeq affinity labels can be compared, aggregated, and learned from at scale.
Comparability: Can we distinguish strong binders from weak binders from non-binders?
Comparability asks whether AlphaSeq KDapp values preserve binding relationships measured across orthogonal biophysical methods. We look for decision-level agreement in two primary settings: (1) do the methods agree in their classification of binders and non-binders, and (2) do the methods agree in their ranking of stronger and weaker binders against a given target, including the correct identification of strengthening or weakening mutations? We demonstrate comparability in both settings with representative datasets.
Classification
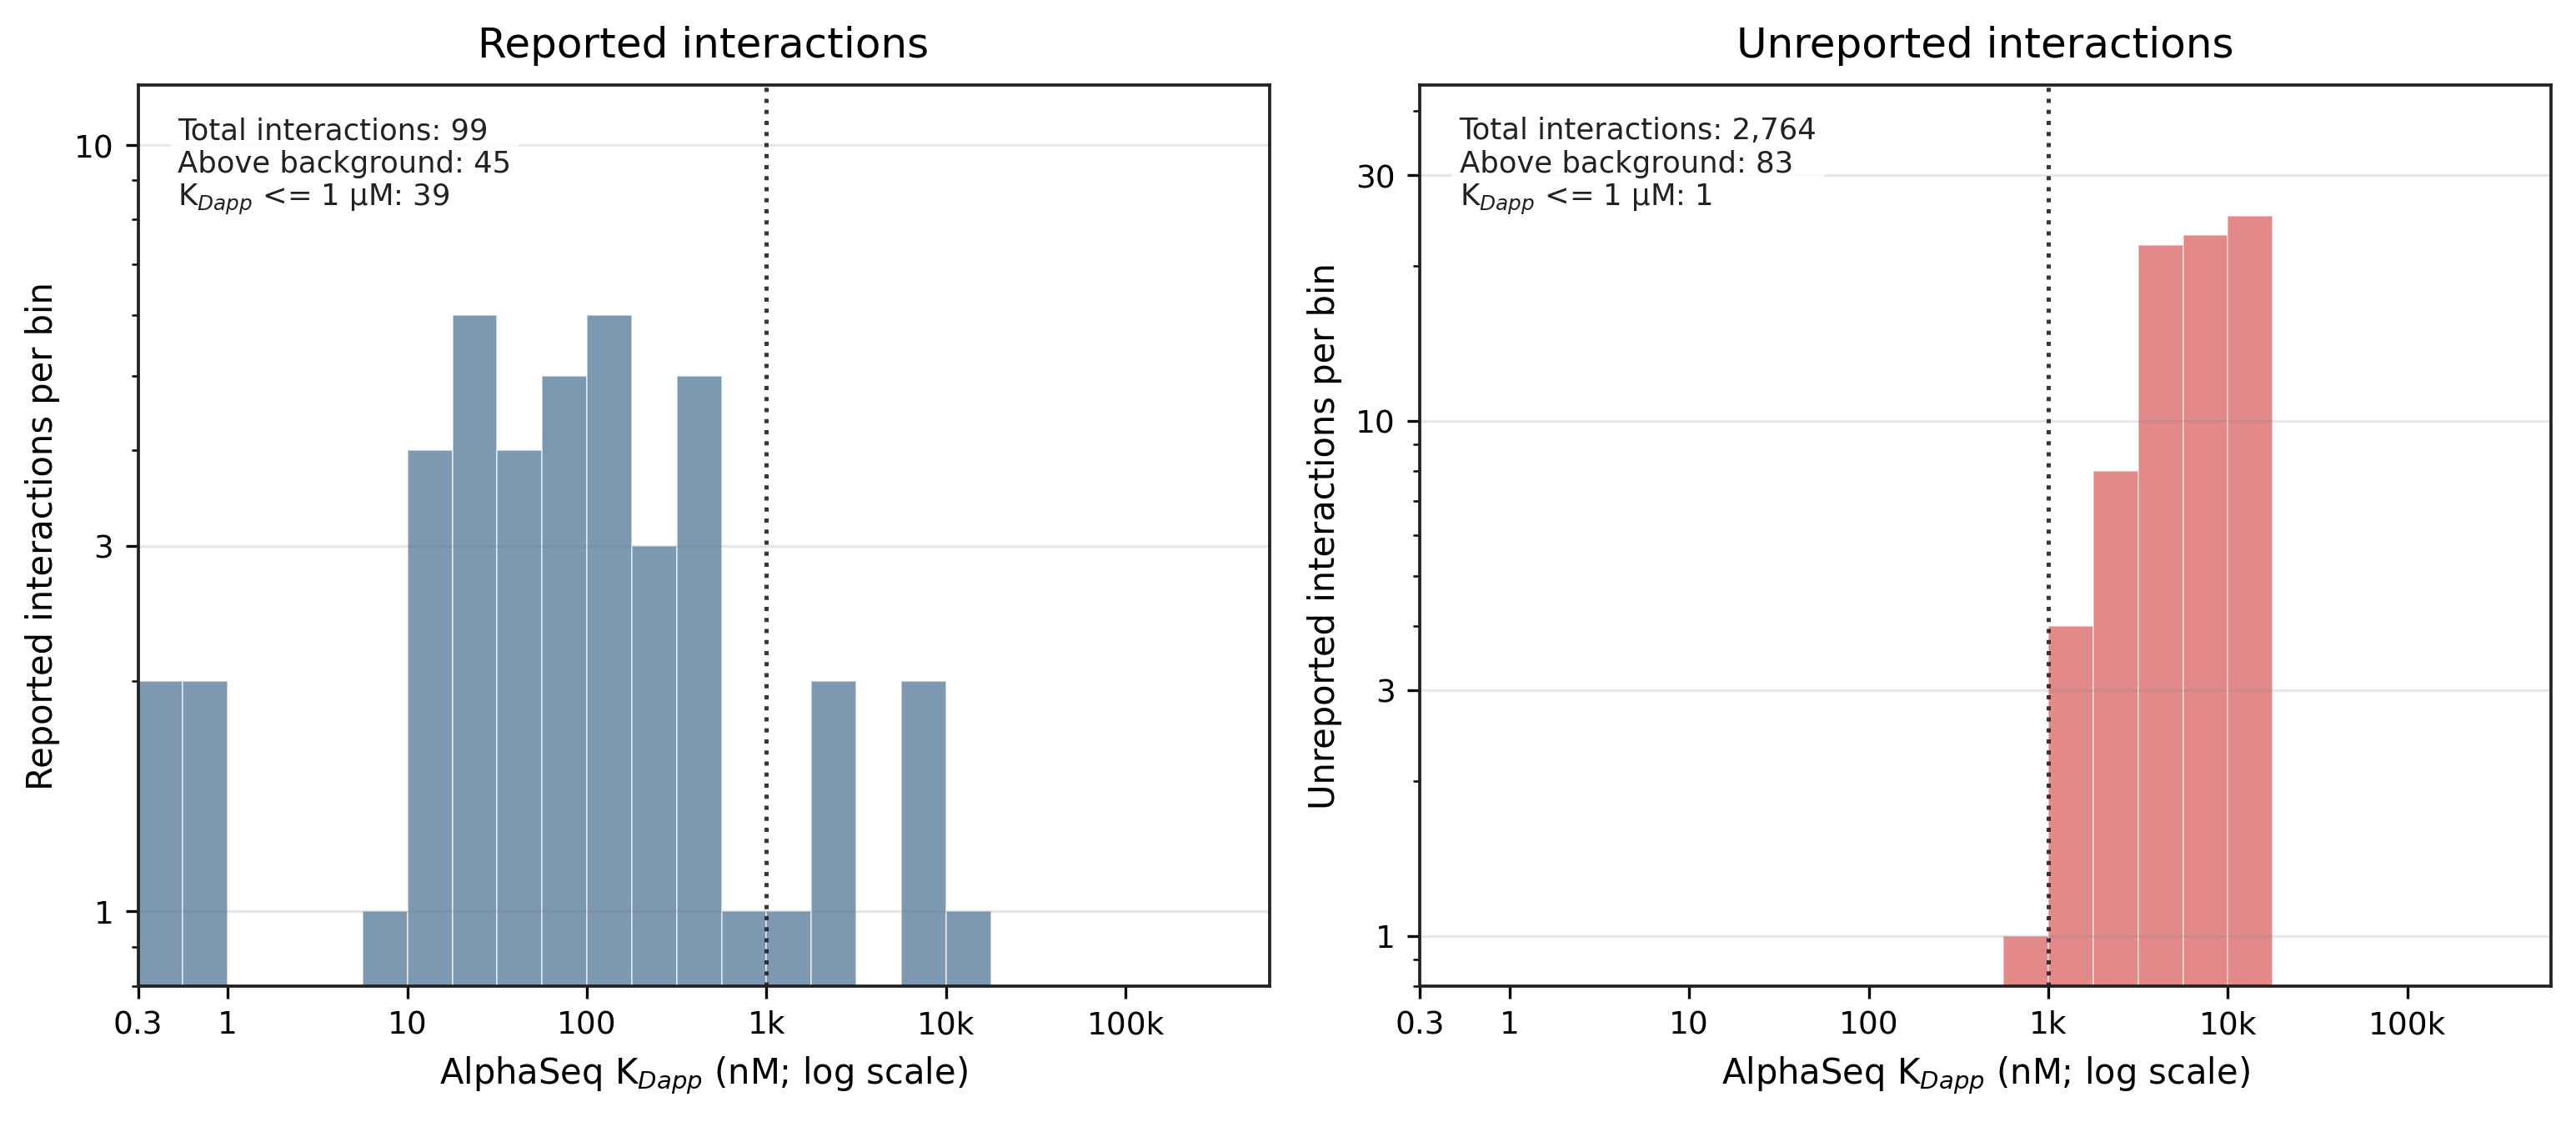
To explore the classification question, we analyzed an AlphaSeq experiment designed to test whether literature-reported interactions with BLI or SPR affinities below 1 uM could be recovered in an AlphaSeq assay. The validation set included 99 reported protein interactions spanning receptor–ligand, antibody–ligand, and antibody–receptor interactions. Because AlphaSeq operates in a library-on-library format, the same experiment also measured 2,764 protein interactions without reported affinity measurements, which were used to calculate a false-positive rate. Each protein interaction was represented by multiple construct designs, truncations, or display orientations, yielding 619 measurements of reported interactions and 17,547 measurements of unreported interactions. For the classification analysis below, we reduced these construct-level measurements to one value per unique protein-protein interaction by using the strongest above-background AlphaSeq affinity measurement across the relevant constructs. Interactions with no measurements above assay background were treated as non-binders.
At a 1 uM affinity threshold, AlphaSeq recovered 39 of the 99 reported protein interactions, corresponding to 39% recall (Figure 3). This recovery rate is consistent with the constraints of a display-based method: some proteins do not express, fold, or present functionally on the yeast surface, and some antibodies lose binding activity when reformatted from full-length IgG into display-compatible fragments such as scFvs. The key practical point is that once a target construct has been shown to display functionally in AlphaSeq, recovery is much stronger for novel binders evaluated against that same format. To date, we have validated thousands of literature-reported protein interactions across hundreds of extracellular and intracellular proteins, and those functionally validated constructs provide the basis for our protein binding data generation efforts. When a high-value target is difficult to display, we use in silico stabilization approaches, such as structure-guided redesign, then verify functional display in AlphaSeq by confirming specific binding to a positive control binder.
The same 1 uM affinity threshold was highly selective across interactions without reported affinity measurements. Among 2,764 unreported interactions, only one appeared as a specific hit, corresponding to an apparent false-positive rate of 0.04%. A key advantage of AlphaSeq for classification tasks is that each protein is tested for binding against a library of other proteins. This library-on-library perspective provides a direct readout of specificity and allows us to distinguish specific protein interactions from nonspecific or polyreactive binding.
Although AlphaSeq separated reported from unreported interactions, the absolute KDapp values were not well correlated with literature affinities. This is not surprising for a comparison that combines measurements from different publications, instruments, protein formats, and assay conditions. We performed a controlled benchmark using internally generated BLI data to assess whether AlphaSeq preserves ranking within defined target systems.
Ranking
To assess whether AlphaSeq preserves the ranking of binders measured by biophysical methods, we generated an internal BLI benchmark across five anonymized target proteins previously validated for functional expression in AlphaSeq. The dataset contained 44 total BLI measurements: 37 with quantitative affinity measurements used for correlation and ranking analysis, plus 7 measurements with AlphaSeq affinity labels, but no detectable binding by BLI. Binders were drawn from internal de novo VHH design campaigns and antibody mutational series, with selections made to cover a range of KDapp values within each target system. This comparison was intentionally focused on binder variants expected to directly impact affinity, such as CDR changes. This matters because broader mutational scans can mix interaction effects with protein-quality effects: framework mutations or antigen mutations can destabilize the displayed protein and reduce functional presentation, causing a loss of KDapp that is not solely due to a weakened binding interface [7].
When comparing affinity values between AlphaSeq and BLI, AlphaSeq preserved the main binding relationships across the five target systems (Figure 4). Binders that appeared weakest by AlphaSeq tended to be weakest by BLI, including several that fell outside the measurable BLI range. Among binders with quantitative BLI measurements, ranking was generally preserved within each target system, with Spearman ρ ranging from 0.55 to 0.90 across the five systems.
As expected, each target system showed a systematic offset between AlphaSeq and BLI. Absolute affinity measurements depend on assay context: AlphaSeq is influenced by target truncation, display orientation, folding, and active protein presentation, while BLI is influenced by immobilization strategy, tag placement, and active protein fraction. We observe this context dependence even within each platform, where changing target format or immobilization strategy can shift the apparent affinity measured for the same binder.
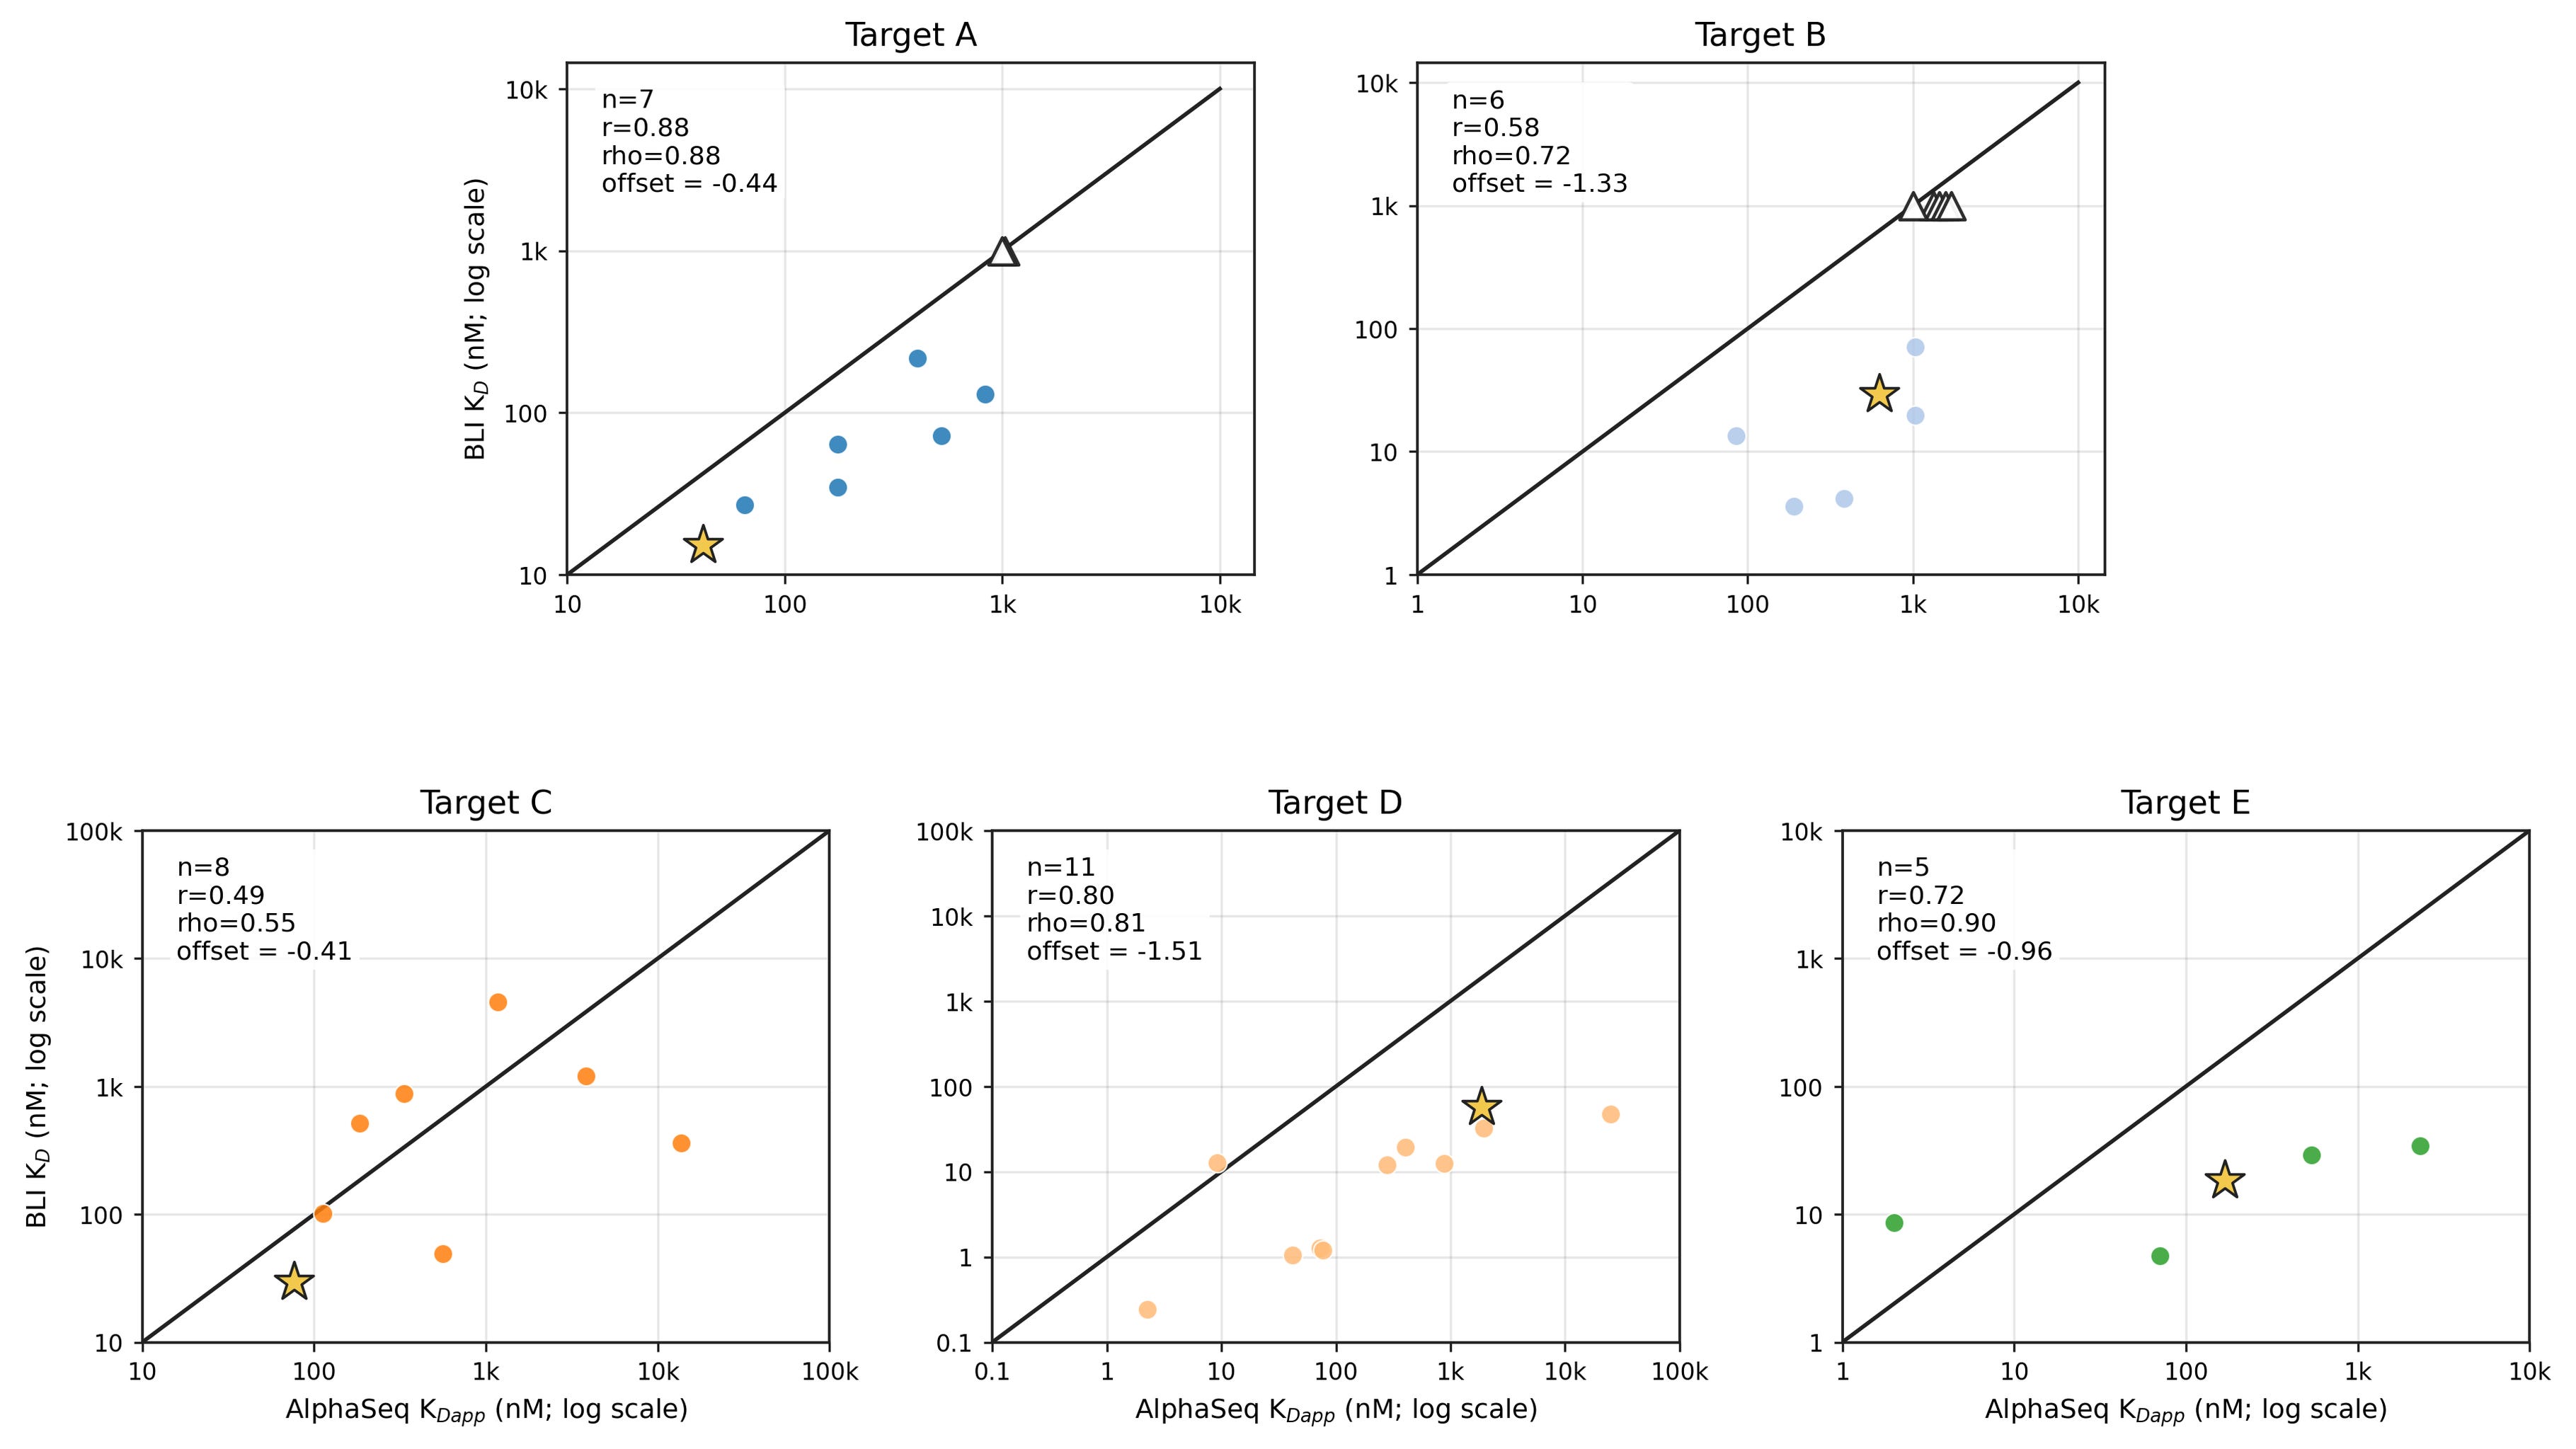
Since absolute affinity measurements are context dependent in both AlphaSeq and BLI, target-specific calibration is necessary when comparing binders across different targets. For projects requiring interoperability between AlphaSeq and BLI across targets, we calibrate AlphaSeq measurements by measuring a small number of interactions in both AlphaSeq and BLI, then applying a target-specific y-intercept offset to the AlphaSeq KDapp measurements. This preserves the within-target ranking while aligning the larger AlphaSeq dataset across multiple targets. We demonstrate this approach in Figure 5, where one interaction from each target is used to set the offset before pooling the calibrated measurements from multiple targets. After calibration, the pooled AlphaSeq and BLI affinity values align closely, with 28 of 32 held-out quantitative measurements falling within one log10 unit in KD space.
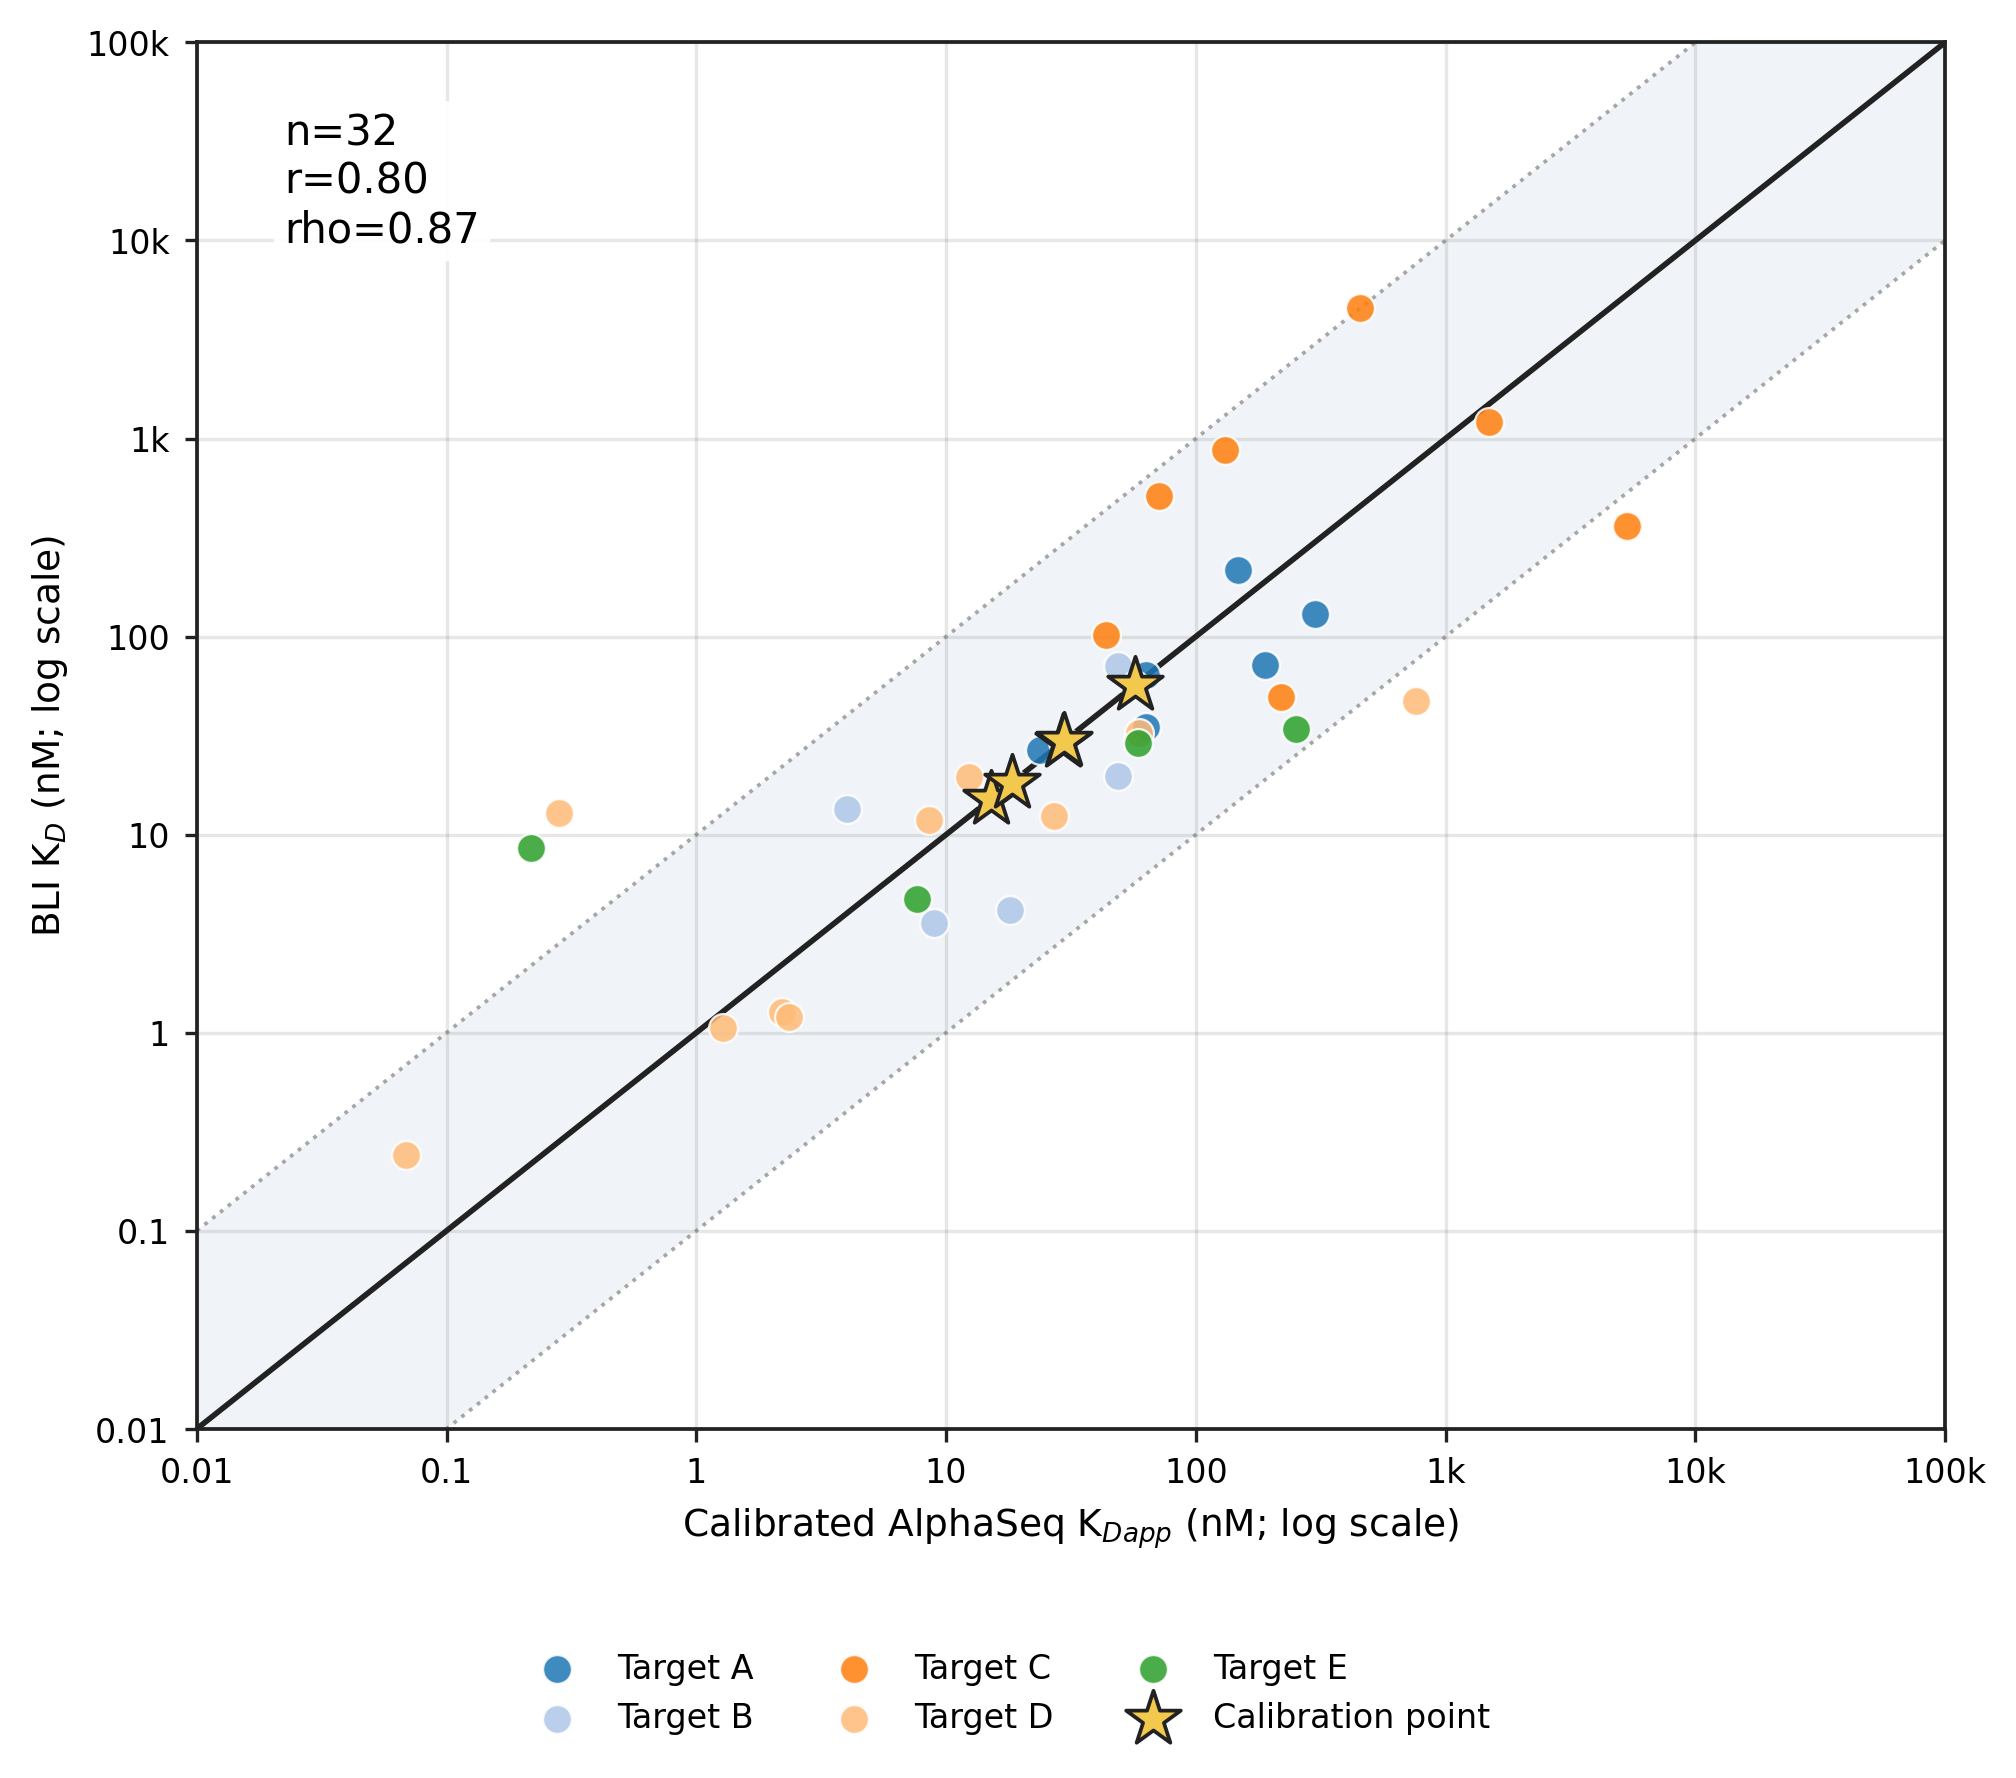
Taken together, these analyses define a practical view of comparability. When targets are functionally displayed in AlphaSeq, the assay supports strong binder/non-binder classification and recovers useful affinity rankings within a defined target context. Among binders, AlphaSeq reports a quantitative KDapp signal across at least four orders of magnitude, enabling comparison of strong, weak, and intermediate interactions within a target, library, or variant series. When affinity values need to be compared across target systems or made interoperable with BLI or SPR, target-specific calibration is used to correct for context dependencies while preserving the within-target binding relationships. For model training, this provides a consistent, high-throughput affinity signal for learning binder/non-binder boundaries, affinity gradients, specificity patterns, and mutational effects, while BLI and SPR remain powerful orthogonal methods for generating kinetic measurements and conducting detailed validation under defined biophysical assay conditions.
Volume: Can we generate enough diverse data to learn binding behavior?
Reproducibility and comparability both relate to data quality. Volume asks whether we can generate the scale and diversity of affinity data needed to train models that learn generalizable binding relationships. This requires measuring weak and strong binders, negatives, cross-reactivity and off-target interactions, as well as mutational neighborhoods across diverse target and binder sequences.
The major advantage of AlphaSeq over biophysical methods is volume: AlphaSeq operates four orders of magnitude beyond the scale of traditional affinity measurements. That scale is possible because of a workflow that is based on pooled DNA from end to end: from a pooled DNA library input to a pooled next-generation sequencing output. This contrasts with other approaches for quantitatively measuring binding affinity, like SPR and BLI, which require isolated protein expression, purification, quality control, and measurement. With the pooled approach, AlphaSeq captures up to one million protein-protein interaction affinity measurements in parallel, while biophysical methods typically scale to a maximum of hundreds of protein interactions at a time.
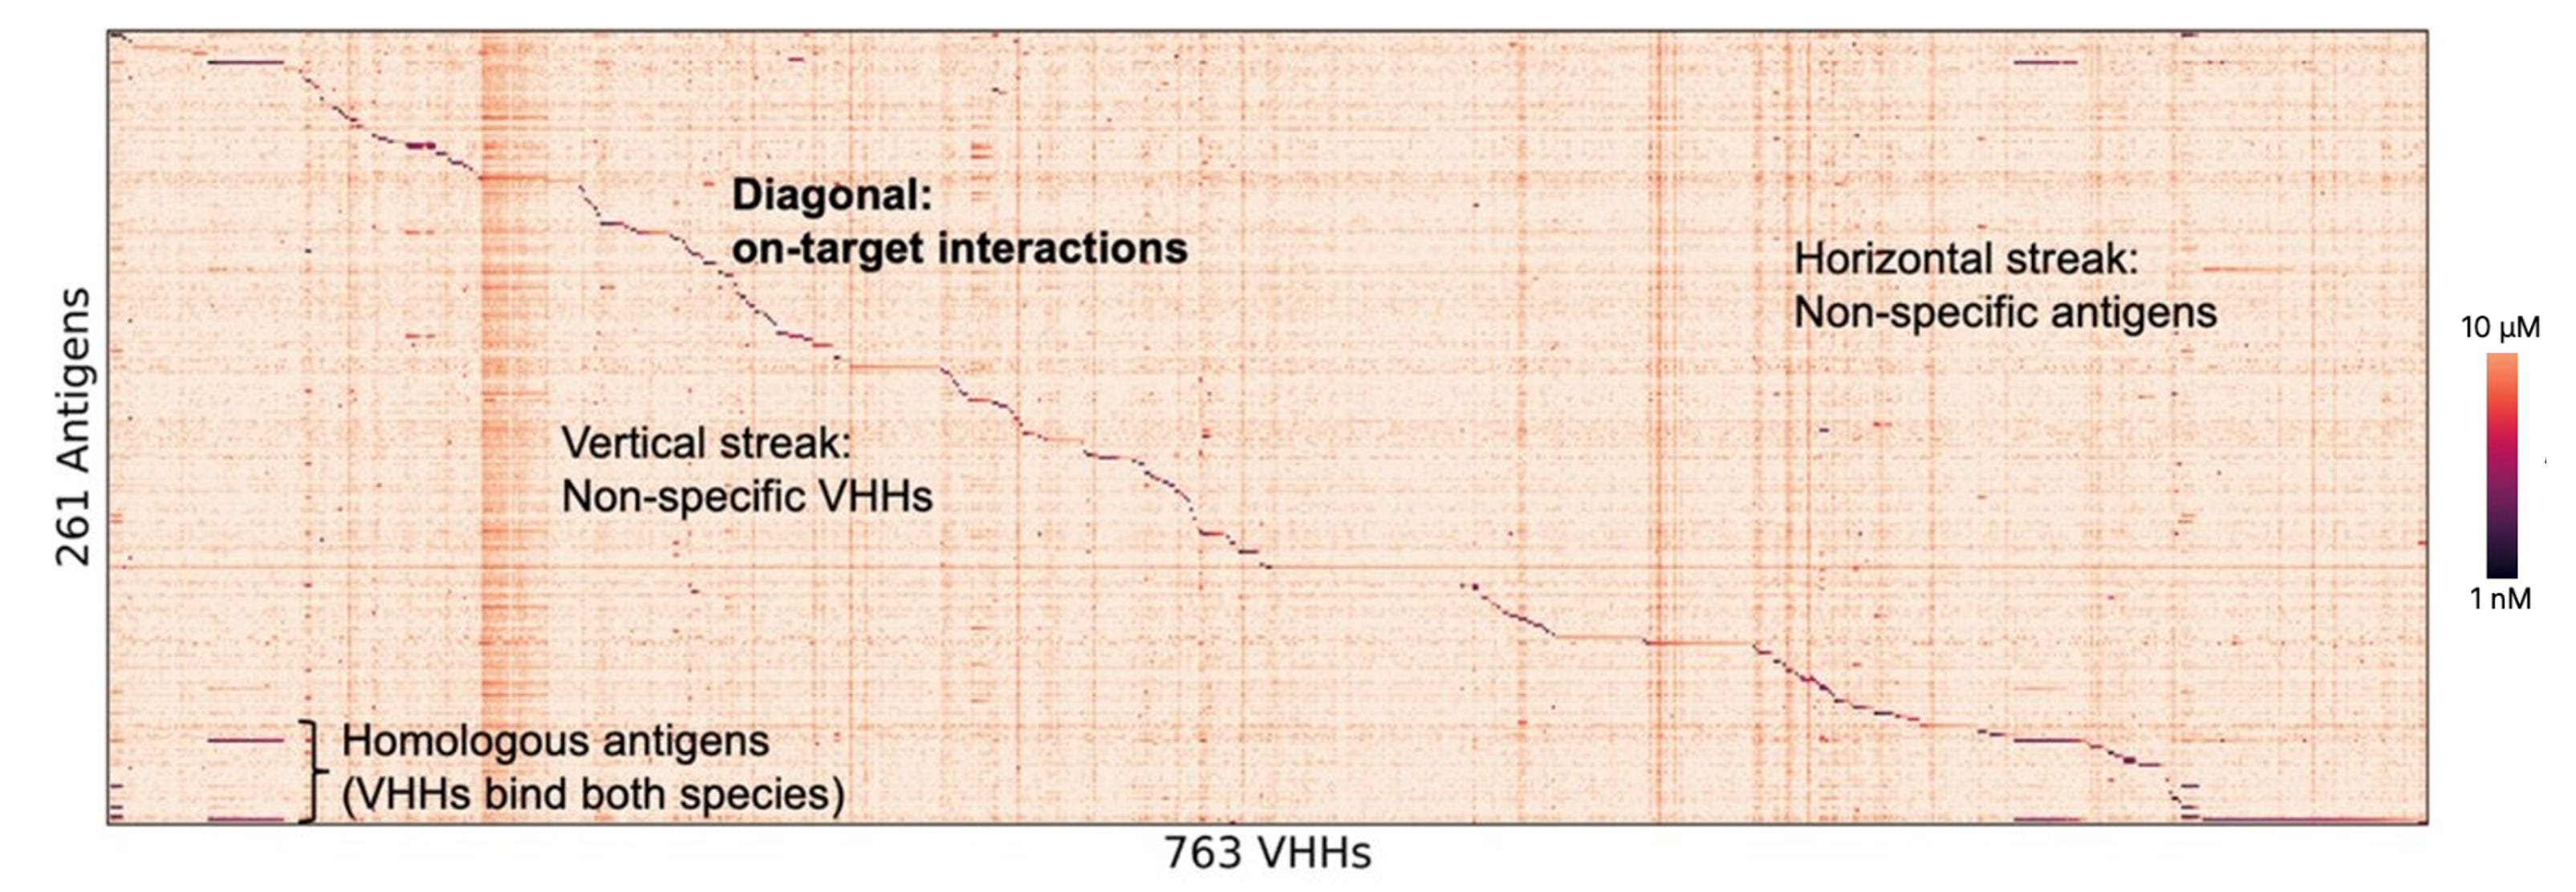
One dataset that exemplifies the information volume contained in an AlphaSeq experiment is a collection of structure-guided VHH affinities. We assembled the majority of structurally characterized VHH-target interactions from the Protein Data Bank (PDB) and measured affinities for all protein interactions between 763 VHHs and 261 antigens together in a single AlphaSeq experiment (Figure 6) [8]. This corresponds to 199,143 VHH-antigen interaction measurements. This dataset serves as a convenient case study for assay volume because of the interpretability of the aggregate affinity data. When the VHHs are sorted on the x-axis by their on-target antigen from the PDB, the on-target interactions appear as a clear stripe along the diagonal. The same pooled assay also measures the surrounding interaction space. We can identify highly specific VHHs, cross-reactive VHHs (those showing strong binding for multiple homologous antigens), nonspecific VHHs (those showing strong binding for multiple unrelated targets), and polyreactive VHHs (those creating a dark vertical stripe). An important note is that on-target binding tends to be strong (~1 nM KDapp) while off-target binding is often far weaker, but still critical for understanding the properties of the binder and certainly for developing therapeutics where even weak nonspecific binding is a major liability.
In subsequent experiments, we explored the mutational space of a subset of these VHH–antigen interactions. For each of 100 selected VHHs, we generated approximately 100 variants containing mutations around the VHH–target interface. We then measured how those mutations strengthened or weakened binding to the respective targets, producing dense affinity landscapes. Together, these datasets comprise millions of protein affinity measurements that connect VHH-target sequence, structure, affinity, and specificity across many parental antibody-target systems and mutational neighborhoods, creating a dataset for training affinity models that would be impractical to build with biophysical assays. This is the kind of structured experimental data we believe is needed to train generalizable affinity models, and in a follow-up post we will describe how affinity landscapes can be used for that purpose.
From affinity values to affinity landscapes
AlphaSeq affinity measurements satisfy the reproducibility and comparability requirements for model training and deliver that data at a volume at least four orders of magnitude beyond what biophysical methods can practically reach. That volume changes what affinity data can do. Rather than characterizing a small number of carefully selected protein interactions, AlphaSeq maps binding across entire libraries, covering sequence diversity and mutational depth simultaneously. Affinity becomes a training signal not just for individual interactions but for understanding which sequences bind, which fail, where specificity breaks down, and how mutations reshape recognition.
The long-term goal of protein design is to move beyond finding binders by screening and toward learning the rules that make protein recognition programmable: designing proteins with defined affinity, specificity, cross-reactivity, and function. Achieving that goal requires models trained on experimental data that capture the structure of binding behavior across diverse sequences and contexts, not just isolated successful binders. Biophysical methods remain essential for detailed characterization of selected purified proteins, measuring binding on and off rates under defined assay conditions. AlphaSeq addresses a different problem: generating calibrated affinity measurements across large libraries, where binders, non-binders, off-target interactions, specificity patterns, and mutational effects are measured together. These landscapes become core infrastructure for model development: training models on binding relationships, fine-tuning them toward specific targets or scaffolds, benchmarking whether they improve, and validating their predictions experimentally.
Acknowledgements
We thank Natasha Murakowska, Ryan Emerson, and David Younger for substantial editorial guidance and critical feedback on the manuscript. We also thank Lucian DiPeso and Emily Engelhart for generating key experimental datasets that contributed to the analyses described here.
References
[1] Younger et al., 2017. High-throughput characterization of protein–protein interactions by reprogramming yeast mating. PNAS. https://doi.org/10.1073/pnas.1705867114
[2] Rich et al., 2009. A global benchmark study using affinity-based biosensors. Analytical Biochemistry. https://doi.org/10.1016/j.ab.2008.11.021
[3] Jarmoskaite et al., 2020. How to measure and evaluate binding affinities. eLife. https://doi.org/10.7554/eLife.57264
[4] Engelhart et al., 2022. A dataset comprised of binding interactions for 104,972 antibodies against a SARS-CoV-2 peptide. Scientific Data. https://doi.org/10.1038/s41597-022-01779-4
[5] Lopez-Morales et al., 2023. Titrating avidity of yeast-displayed proteins using a transcriptional regulator. ACS Synthetic Biology. https://doi.org/10.1021/acssynbio.2c00351
[6] Kramer et al., 2012. The experimental uncertainty of heterogeneous public Ki data. Journal of Medicinal Chemistry. https://doi.org/10.1021/jm300131x
[7] de Kanter et al., 2026 preprint. Effects of protein interface mutations on protein quality and affinity. https://doi.org/10.64898/2026.03.24.713863
[8] Noble, 2025. Pairing large-scale binding affinity measurements with antibody–antigen structures. To Affinity And Beyond. https://aalphabio.substack.com/p/pairing-large-scale-binding-affinity
Good post -- the within-target Spearman values in Fig 4 look like the real result. Question on the Fig 5 calibration, though. In four of the five panels the points seem to fan away from the diagonal as KDapp increases rather than sitting parallel to it, which would suggest a slope below 1 rather than a pure offset. Target E looks like the clearest case: the points span roughly three logs on x and well under one log on y. Have you fit slopes per target, and do they come out near 1? Worth asking because r and rho are both slope-blind -- E gets rho=0.90 either way -- so nothing in the reported statistics would flag it.
If the slope is materially below 1, an intercept-only correction aligns near the anchor and drifts away from it in both directions, which makes the choice of anchor matter a lot. So, relatedly: how were the five calibration points chosen, and have you run the leave-one-out version, recalculating the offset from each candidate anchor and reporting how the 28/32 count moves? The per-point offsets within a target look wide from the panels -- Target D spans something like two logs across its eleven measurements.
Practically: when a partner runs this on a new target, how many paired BLI measurements do they actually need before the offset stabilizes? One, or is that a demonstration convenience and the real answer closer to three to five?
One suggestion, offered in the spirit of it being the same analysis you're already doing: a hierarchical model with a random intercept per target would give you standard errors on each offset rather than point estimates, and would shrink the small-n targets toward the global mean instead of estimating E's offset from five points. Adding a random slope would answer the first question directly. It also handles the partner case cleanly -- "I've measured two binders on a new target, how much should I trust the offset" is a posterior for a new group, with honest uncertainty attached. With five targets the variance components would be wobbly, but that seems worth knowing too.